Information Theory and Performance Ratings
What non-linear optics and information theory can teach us about the limits of our measurements.

In an optics lab, your first lesson is a humbling one: your measurement is almost never what you think it is. I spent years calibrating sensors to detect the faintest signals in nonlinear optics, only to realize that an “exciting new phenomenon” was often just the 60Hz hum of the laboratory’s electrical outlets. You learn to distrust the device, the environment, and especially your own observation.
Now, overseeing People Analytics for a global workforce of hundreds of thousands, I find the measurement traps are the same. Organizations spend billions of dollars and millions of hours on the annual ritual of performance ratings, often treating a 1-to-5 scale as a high-fidelity instrument. But if we apply the first principles of information theory, we discover that we aren’t using a high-resolution “microscope”; we are using a blunt sensor with a hard mathematical ceiling that filters out the very “star performance” we are trying to find.
The most important thing to know about performance ratings is that they are a VERY low resolution measurement. That doesn’t mean they’re a waste of time, it just means we have to be careful about the conclusions we draw based on an extremely fuzzy image of the workforce.
1. A Gedankenexperiment
To illustrate just how fuzzy these ratings are, let’s use a much easier thing to measure directly than performance time. Imagine we have a completely remote workforce and we’re trying to figure out when people are starting their day. We’ve decided the simplest way to do this is to ask their managers what time each person is starting. But… here’s the catch… for simplicity instead of asking them to record the time we tell them they can only use the numbers 1, 2, 3, 4, or 5.
After communicating the new effort to all managers we begin to receive the data and try to reconstruct the work habits of our company. It doesn’t take long before we realize that we have a problem:
The Rater Effect: Manager A uses a standard 12-hour analog wall clock and assigns a “1” for anyone starting before 2:24 AM. Manager B uses military time so assigns a “1” for anyone starting before 4:48am. Manager C uses “1” for the first 20% of their team, regardless of how early or late they started.
Data Destruction: We look at each of our 2s and realize we cannot reliably make any inference about what time any individual started. That information was erased when the manager converted it to a single integer.
The “Artifact” Curve: As we look at the data we think we see patterns and decide to calculate some statistics based on these 1-5 time ratings. We find that we have what looks like the old familiar Bell Curve (Normal distribution) centered at about 3. The problem is that this curve doesn’t represent when people start work; it is a mathematical artifact created by averaging out the different ways managers used the numbers.
What decisions can we make based on this data? Would it make sense to recognize all the 1s and 2s for having healthy work habits? What time does 2.43 represent?
This little thought experiment maps almost perfectly onto the real-world challenge with performance ratings. Scullen, Mount, and Goffin (2000) found that when using a 5-point scale to measure performance, the idiosyncrasies of the raters accounted for nearly two thirds of the variance. If more than 60% of the variance is the rater, then the “signal” we are getting is a social one. The simple subjective scale is telling us more about the managers (how they used the scale) than about the employees they are measuring.
If the challenge was simply the idiosyncrasies of the raters the solution would be simple but it goes deeper than that. Using 5 digits to represent the 1440 minutes of the day erases information we can never get back.
2. The Information Bottleneck
Now let’s imagine that after collecting all of the time “measurements” from our managers we’ve realized our mistake and we give them very specific definitions for each number on our 5-point scale. We further give them a standard procedure to validate the number they’ve assigned. To make sure we get the most accurate number we implement a “360” measurement that asks each employees’ peers and direct reports to also submit a number using the same criteria. We’ve done everything perfectly to ensure we have the most robust categorization of every employee into 1 of 5 categories. Do we now have a good measurement?
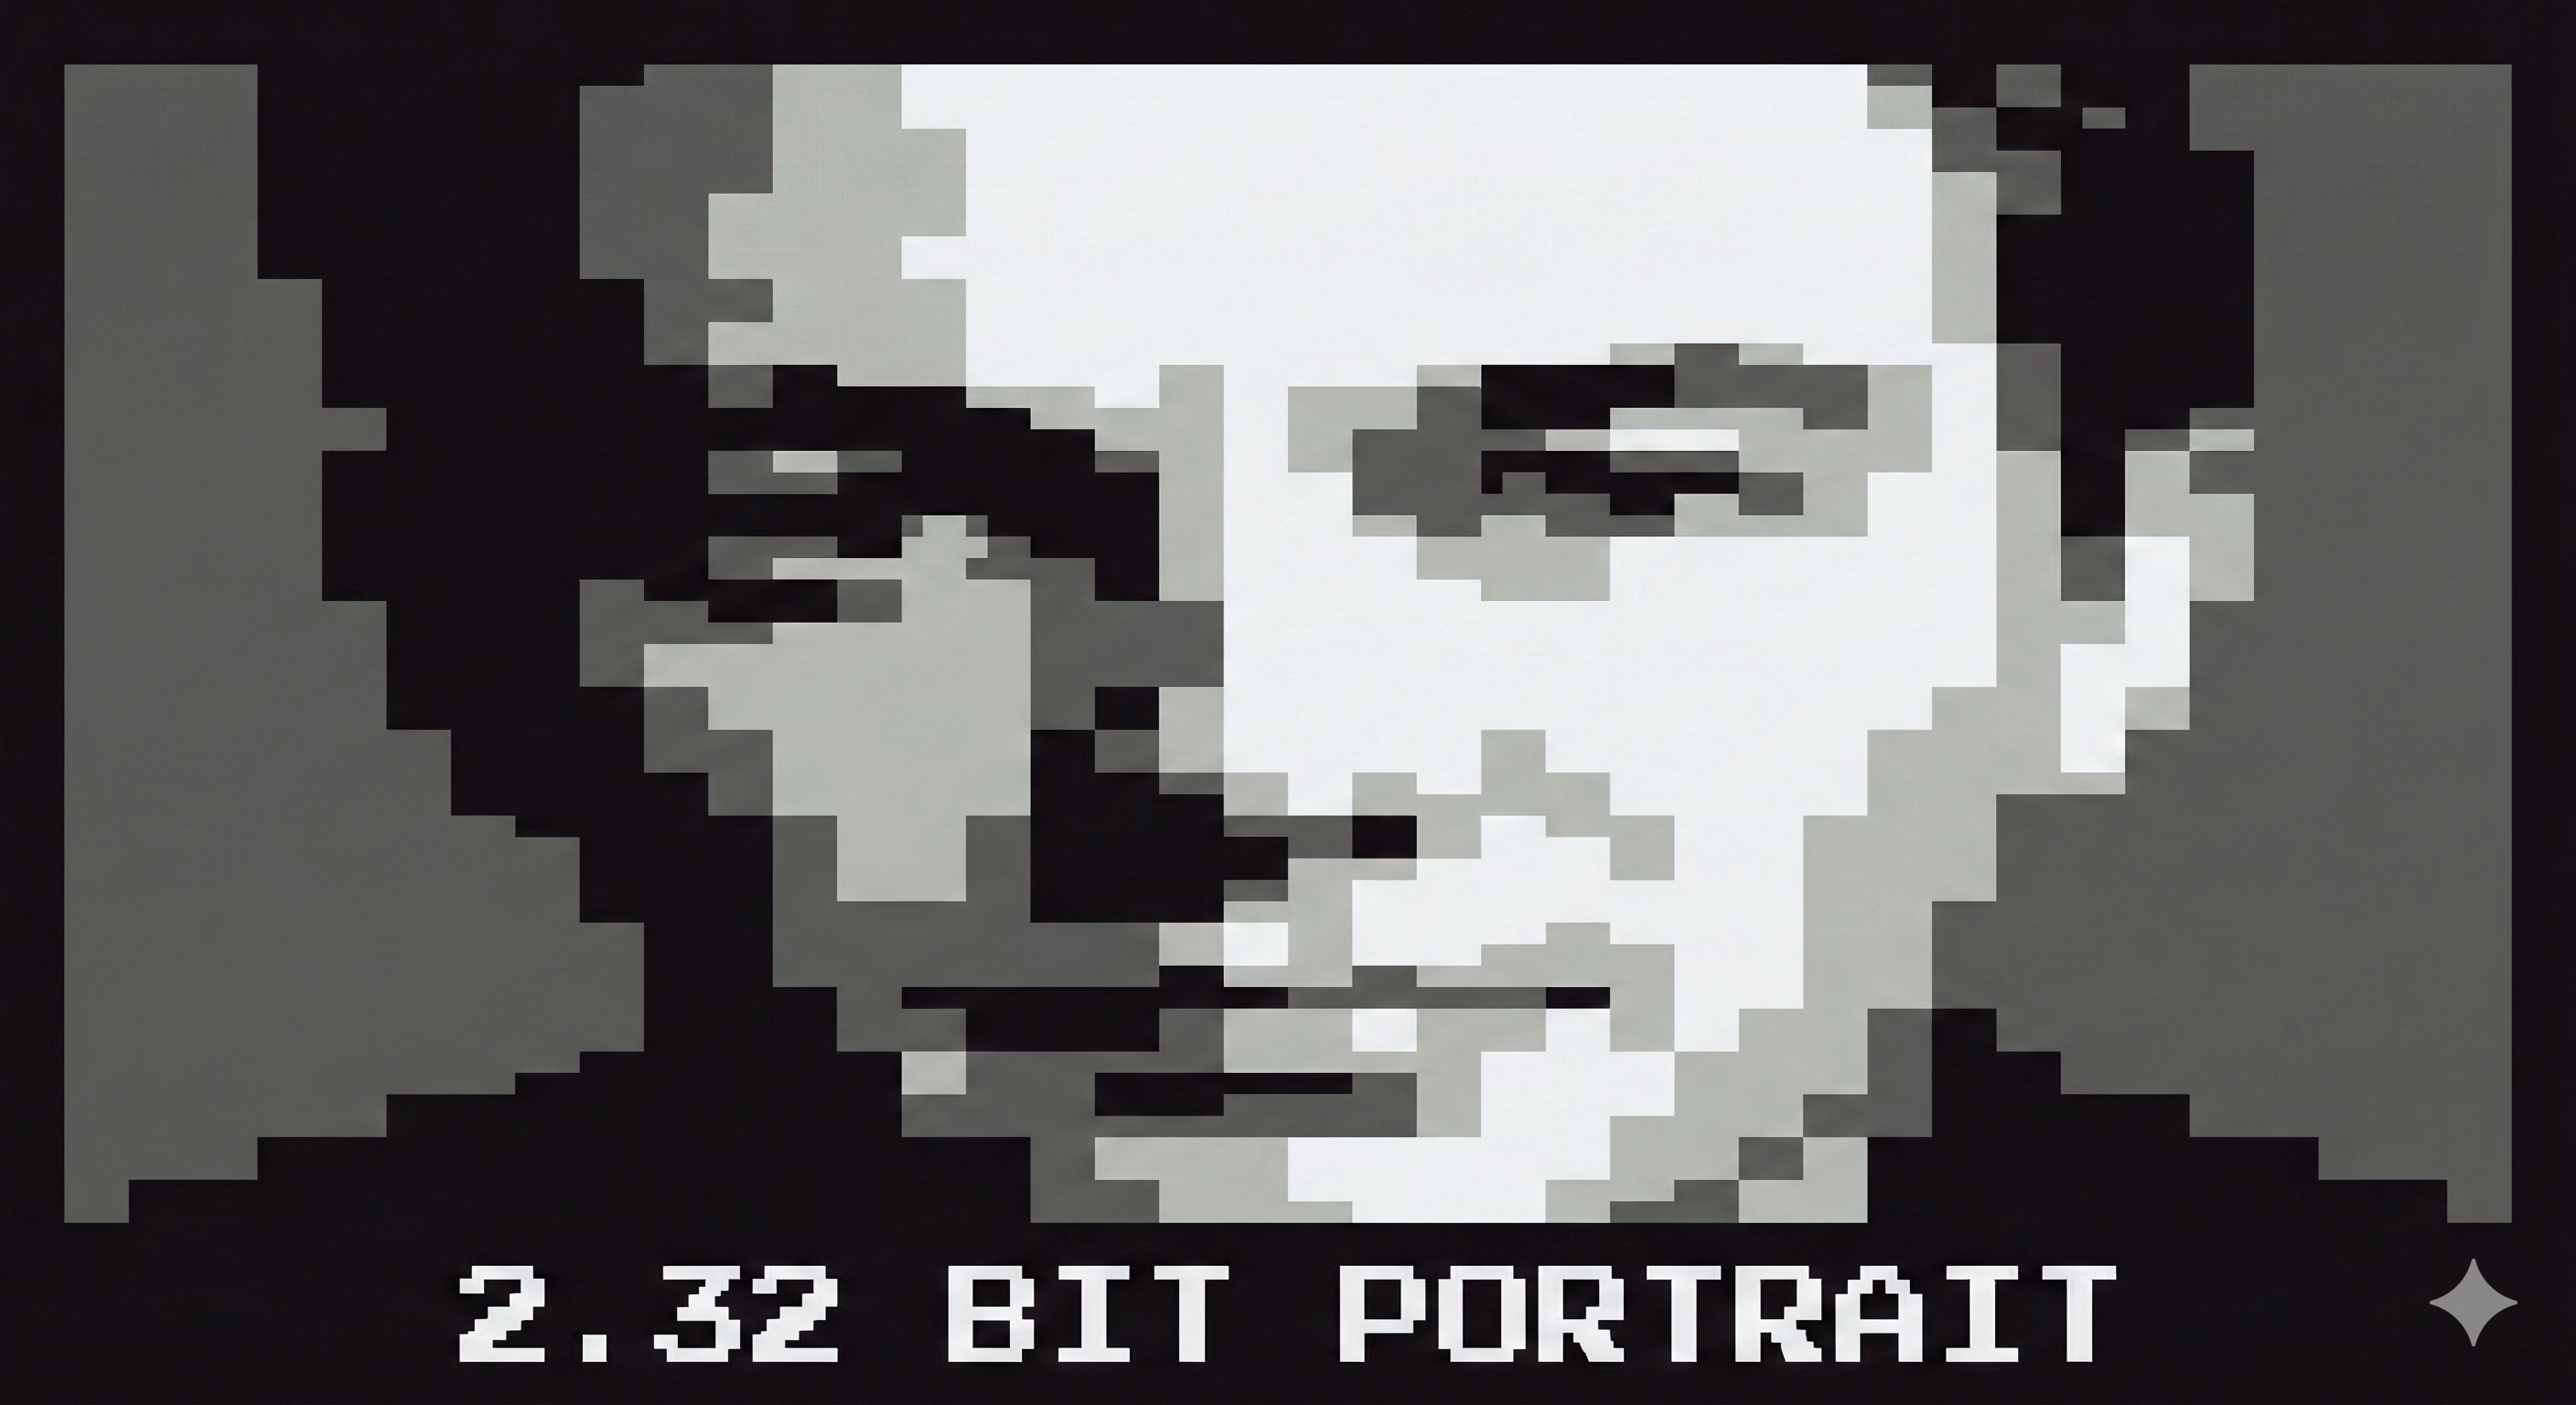
While we can be more confident in the numbers we have, the scale itself introduces a significant limit on our ability to produce a high-resolution picture of what is actually happening. Based on Information Theory, a standard 5-point scale has a theoretical maximum information content (entropy) of just 2.32 bits. To put that in perspective, a single emoji contains more data than the typical performance rating.
The natural inclination may be to simply use more numbers. Wouldn’t a 100-point scale give us finer resolution?
Unfortunately more categories won’t necessarily translate into a better measurement. Based on George Miller’s “Magical Number Seven,” the human brain only has about a 2.8-bit capacity to process categorical information. Even if you gave a manager a 100-point scale, they would instinctively “bin” the data into about seven categories. As a measurement device, the human brain is physically incapable of maintaining the resolution required to distinguish between a “92” and a “93” in human performance.
These limitations on the information we are able to capture with a rating scale only compound when applied to complex phenomena. It’s much like asking someone to categorize a car as a circle, a square, or a triangle.
3. The Power Law
To understand just how inadequate humans are as measurement devices for our own performance we have to take a step back and understand what we’re trying to measure.
Most human traits, like height and weight, follow a Normal Distribution (the Bell Curve). As humans our intuition is built around a “Normal” world, the tallest person you know is probably less than twice as tall as the average person you know. The heaviest person you know is probably only about twice as heavy as the average person you know. A simple symmetric Normal distribution can be reasonably approximated with 5 to 7 categories, and often is. But not everything works like height and weight. Wealth, time spent in a car, and size of pokemon card collections follow a completely different curve called a Power Law distribution.
In a Power Law world, the far end of the curve isn’t 2x the average, it can be 1,000,000x. The median number of YouTube subscribers is 61, Mr. Beast has 460 million. If our goal was to identify and reward the most influential YouTube stars it would be very important to capture not only who they are but how much more influential they are than the typical content creator. To do this we need a measurement device that is up to the task. Because we can directly measure subscribers and views it’s easy, we can simply count using 32-bit integers.
If we tried to rate YouTube content creators based on the best our brains had to offer, a 7-point scale, we’d end up with a very distorted picture. In fact we’d end up with something that looked sort of like a normal distribution, reflecting the preferences of the raters, not the success of the YouTube channels.
Performance for many knowledge workers follows a Power Law distribution. One average developer might fix three bugs, while the best developer builds the architecture that saves the entire company. An average leader might keep their team happy, while the best leader will transform an industry. When we try to “measure” this performance using a scale and human judgement we distort reality beyond recognition.
So is it hopeless? Is this measurement worthless? Absolutely not.
4. Painting a More Realistic Picture
Abandoning performance ratings is not a good alternative. Attempts at “ratingless” performance reviews have resulted in very poor results including lower performance, shadow ratings, and a sense of aimlessness. The understanding that each person will be held accountable for their contributions has a tremendous effect on the productivity of the company.
However, performance ratings are rarely measures of performance. They are a tool for alignment, a shorthand for organizational consensus, and a “check-engine light” for engagement. We can get more out of this measurement by making the current approach as robust as possible and by not settling for the status quo.
Companies that have demonstrated more effective performance ratings have done so by directly addressing the low-resolution challenge. Here are a few techniques that will get the most out of your 2.32 bits:
Increase Sampling Frequency: Moving to continuous data collection to smooth out errors.
Measure Intent, Not Truth: Ask managers what they would do (pay, promote) rather than what the employee is (a “5”).
Aggregate Sensors: Using 360-degree data (despite its cost) to triangulate the signal.
Accept Subjectivity: Recognize that the rating is a communication tool for alignment, not a measurement of performance or output.
In order to challenge the status quo we need to experiment with new ways to capture more information about the output of the workforce. I’m not suggesting or recommending that we use AI to auto-magically produce ratings. I am suggesting that measurements like centrality, could give us a much more proximate, information-rich measure of the influence a person is exerting on the organization. AI-connected companies may be able to produce such measurements more cheaply and reliably than at any time in the past. The real value would be in the objective nature of the measurement and that it tends to follow a Power Law distribution, thereby mirroring what we’d expect from performance.
We are experiencing a watershed moment in workplace technology. Thinking about AI and agents as only tools for productivity misses the vast opportunities for observability and measurement. Our job will be to discover and validate those measurements and implement them with the highest standards of transparency so that we don’t create a high-precision dystopia.