Some things aren’t predictable.
A speculation on chaos and the fundamental limits of AI prediction for individual performance.

One of my favorite physics demonstrations is also one of the simplest. The professor sets up a simple pendulum. They pull it back and release it. We are all familiar with a pendulum and are not surprised when it swings back and forth in a perfect, predictable rhythm. You could literally set your watch to it.
A simple, linear system, like the pendulum, lends itself to a simple equation. As long as you know a few facts about the length, mass, and starting position, you can predict exactly where it will be in ten seconds, ten minutes, or ten years.
Then things get interesting. The professor attaches a second pendulum to the bottom of the first one. This new contraption is called, you guessed it, a Double Pendulum.
He asks the class what they think it’s going to do. Everyone agrees it will swing much like the first one, perhaps with some extra wiggles. He releases it, and for the first swing, the class feels smart; everything looks normal.
But then, everything goes wrong. It loops, jerks, stalls, and spins. The professor resets it and does it ten more times, starting from the exact same spot. Each time, it takes a wildly different path. It never repeats the same motion twice. The class is stupefied. It is still a mechanical system. The laws of motion haven’t changed. Gravity hasn’t changed. Yet, adding one degree of freedom turned a deceptively simple system into something completely unpredictable.
People Analytics teams have been tasked with predicting individual performance since the discipline was born. We’ve built regression models, assessed skills, and analyzed engagement surveys, all to identify who has the potential to make the biggest impact. While there have been substantive advancements in understanding teams, prediction at the individual level has remained elusive.
If individual performance is the product of a chaotic system, like the double pendulum, then no algorithm, no matter how advanced, will ever be able to provide a meaningful long-term prediction.
Physical Systems: A Field Guide
In some situations, prediction will always be elusive, and no model in the world can change that. To understand why, we have to consider what kind of system we are managing. Generally, systems fall into four categories:
Simple/Linear Systems (The Pendulum): Input is proportional to output. If you push a lever twice as hard, it moves twice as far. These systems are straightforward to manage. For example, you might notice that call center volume is proportional to the number of employees enrolling in benefits. You predict a spike during Open Enrollment, increase staffing, and the problem is solved.
Random/Stochastic Systems (The Casino): The outcome of any single event is pure luck (like rolling a die), but the aggregate is predictable. You cannot predict a single roll, but you can predict the average of 1,000 rolls with extreme precision. This is where statistical methods shine. Assessments work this way: you can’t ensure any individual hire is the right one, but you can ensure that, over thousands of hires, your “hit rate” improves.
Complex/Adaptive Systems (The Ecosystem): The parts interact and learn. If you poke the system, it adapts and changes its own rules. You can’t predict it exactly, but you can understand its patterns. Company culture is a complex system. If you’ve ever tried to “transform” culture, you know you can’t dictate it; you can only guide or shape it, because it never stops evolving.
Chaotic/Non-Linear Systems (The Double Pendulum): This one can fool you. Chaotic systems aren’t random. They are deterministic—they follow strict rules—but they are highly sensitive to initial conditions. Microscopic differences in the start lead to macroscopic differences in the end.
Most HR models assume human performance is Type 1 (Linear) or Type 2 (Random). We assume that if we have enough data, the “noise” will average out. Dave Snowden’s Cynefin framework famously distinguishes between Complex and Chaotic domains, noting that in a Chaotic system, cause and effect are only perceivable in hindsight. In these systems, small differences don’t average out; they are amplified.
But is performance actually Chaotic? To be sure, we have to rule out the alternatives.
If it were Random, high performers would eventually “regress to the mean” and become average. They often don’t.
If it were Linear, adding more resources would always equal more output. It doesn’t (Fred Brooks famously proved this in The Mythical Man-Month).
Individual performance behaves like a Coupled System. You cannot solve for an employee’s performance without simultaneously solving for their Manager and their peers. Like the physics of a double-pendulum, people push and pull on each other, creating a complex, looping topology where outcomes are deterministic but unpredictable.
A missing laptop on Day 1 doesn’t just mean a lost day of work; under the right conditions, it can spiral into a lost career. If this is true, attempting to predict who will be a “High Performer” is a mathematical dead end.
Evidence of Chaos: Sensitivity to Initial Conditions
In the double pendulum, the infinite variation in swinging patterns is a result of extreme sensitivity to initial conditions, not randomness. It’s not that the pendulum randomly decides to switch directions; it’s that a variance of a fraction of a millimeter at the start leads to a totally different result 10 seconds later.
This matters because outcomes in chaotic systems are explainable even if they are not predictable.
Imagine we hire twin employees, Alice and Bob. They have statistically identical resumes, IQs, and psychometric traits. They are hired for the same role, on the same day, into the same team.
Linear View: Their performance in Year 1, 10, and 30 should be identical.
Random View: Their performance might differ in Year 1, but over 30 years, their averages would converge.
Complex View: Their performance might diverge as they move to different groups (adapting to environments), but reunite if they return to the same environment.
Evidence suggests that individual performance often defies these models and behaves chaotically. Consider this scenario:
Day 1, 9:00 AM: Alice’s laptop is ready. Bob’s laptop is delayed by IT for 4 hours. A trivial, microscopic difference.
12:00 PM: Because he has no laptop, Bob misses the Slack message inviting the team to lunch. Alice goes.
1:00 PM: At lunch, the team jokes about a “Project X” disaster from last year. Alice learns the unspoken rule: Never mention Project X to the VP. Bob, eating a sandwich alone at his desk, does not learn this.
Month 2: In a meeting, Bob innocently compares a new idea to Project X. The VP grimaces. Bob is labeled “tone-deaf.” Alice stays silent and is labeled “politically savvy.”
Year 1: Alice is marked as High Potential. Bob is on a Performance Plan.
The stigma of the performance plan never leaves Bob. His motivation sags, his engagement withers, and he leaves after two years.
Was Bob a “bad hire”? No. Remember, the candidates were identical. The only difference was the initial condition (the laptop), which caused their paths to irreversibly diverge. This sensitivity is the hallmark of a chaotic system.
A Bit About Chaos
Although the specific sequence of events in a chaotic system is unpredictable, patterns do emerge. In physics, we call these patterns Attractors.
In a human organization, it is easier to think of Attractors as Currents.
Imagine Bob and Alice are kayakers on a river. You cannot predict the exact path of either kayaker. The paddler has agency; they are dodging rocks and adjusting their weight. Their path is “non-deterministic”—no two runs down the river will ever be the same.
The Riverbed determines the currents they will encounter.
Consider the Topology Diagram below through this lens:
The “Burnout Trap” (The Whirlpool): Notice the deep funnel at the bottom. This is a point where the current becomes too strong to fight. Once a kayaker drifts into this high-drag, high-pressure zone, the physics of the water pulls them under. It’s not that they “chose” to fail; it’s that the current overpowered their agency.
The “High-Performance Orbit” (The Eddy): Notice the ring at the top. In a river, an eddy is a place where the water swirls back upstream. It’s a dynamic sweet spot. The kayaker is still moving fast, still balancing, still working—but the water supports them. They can stay there indefinitely, in a state of “Flow,” without washing away.
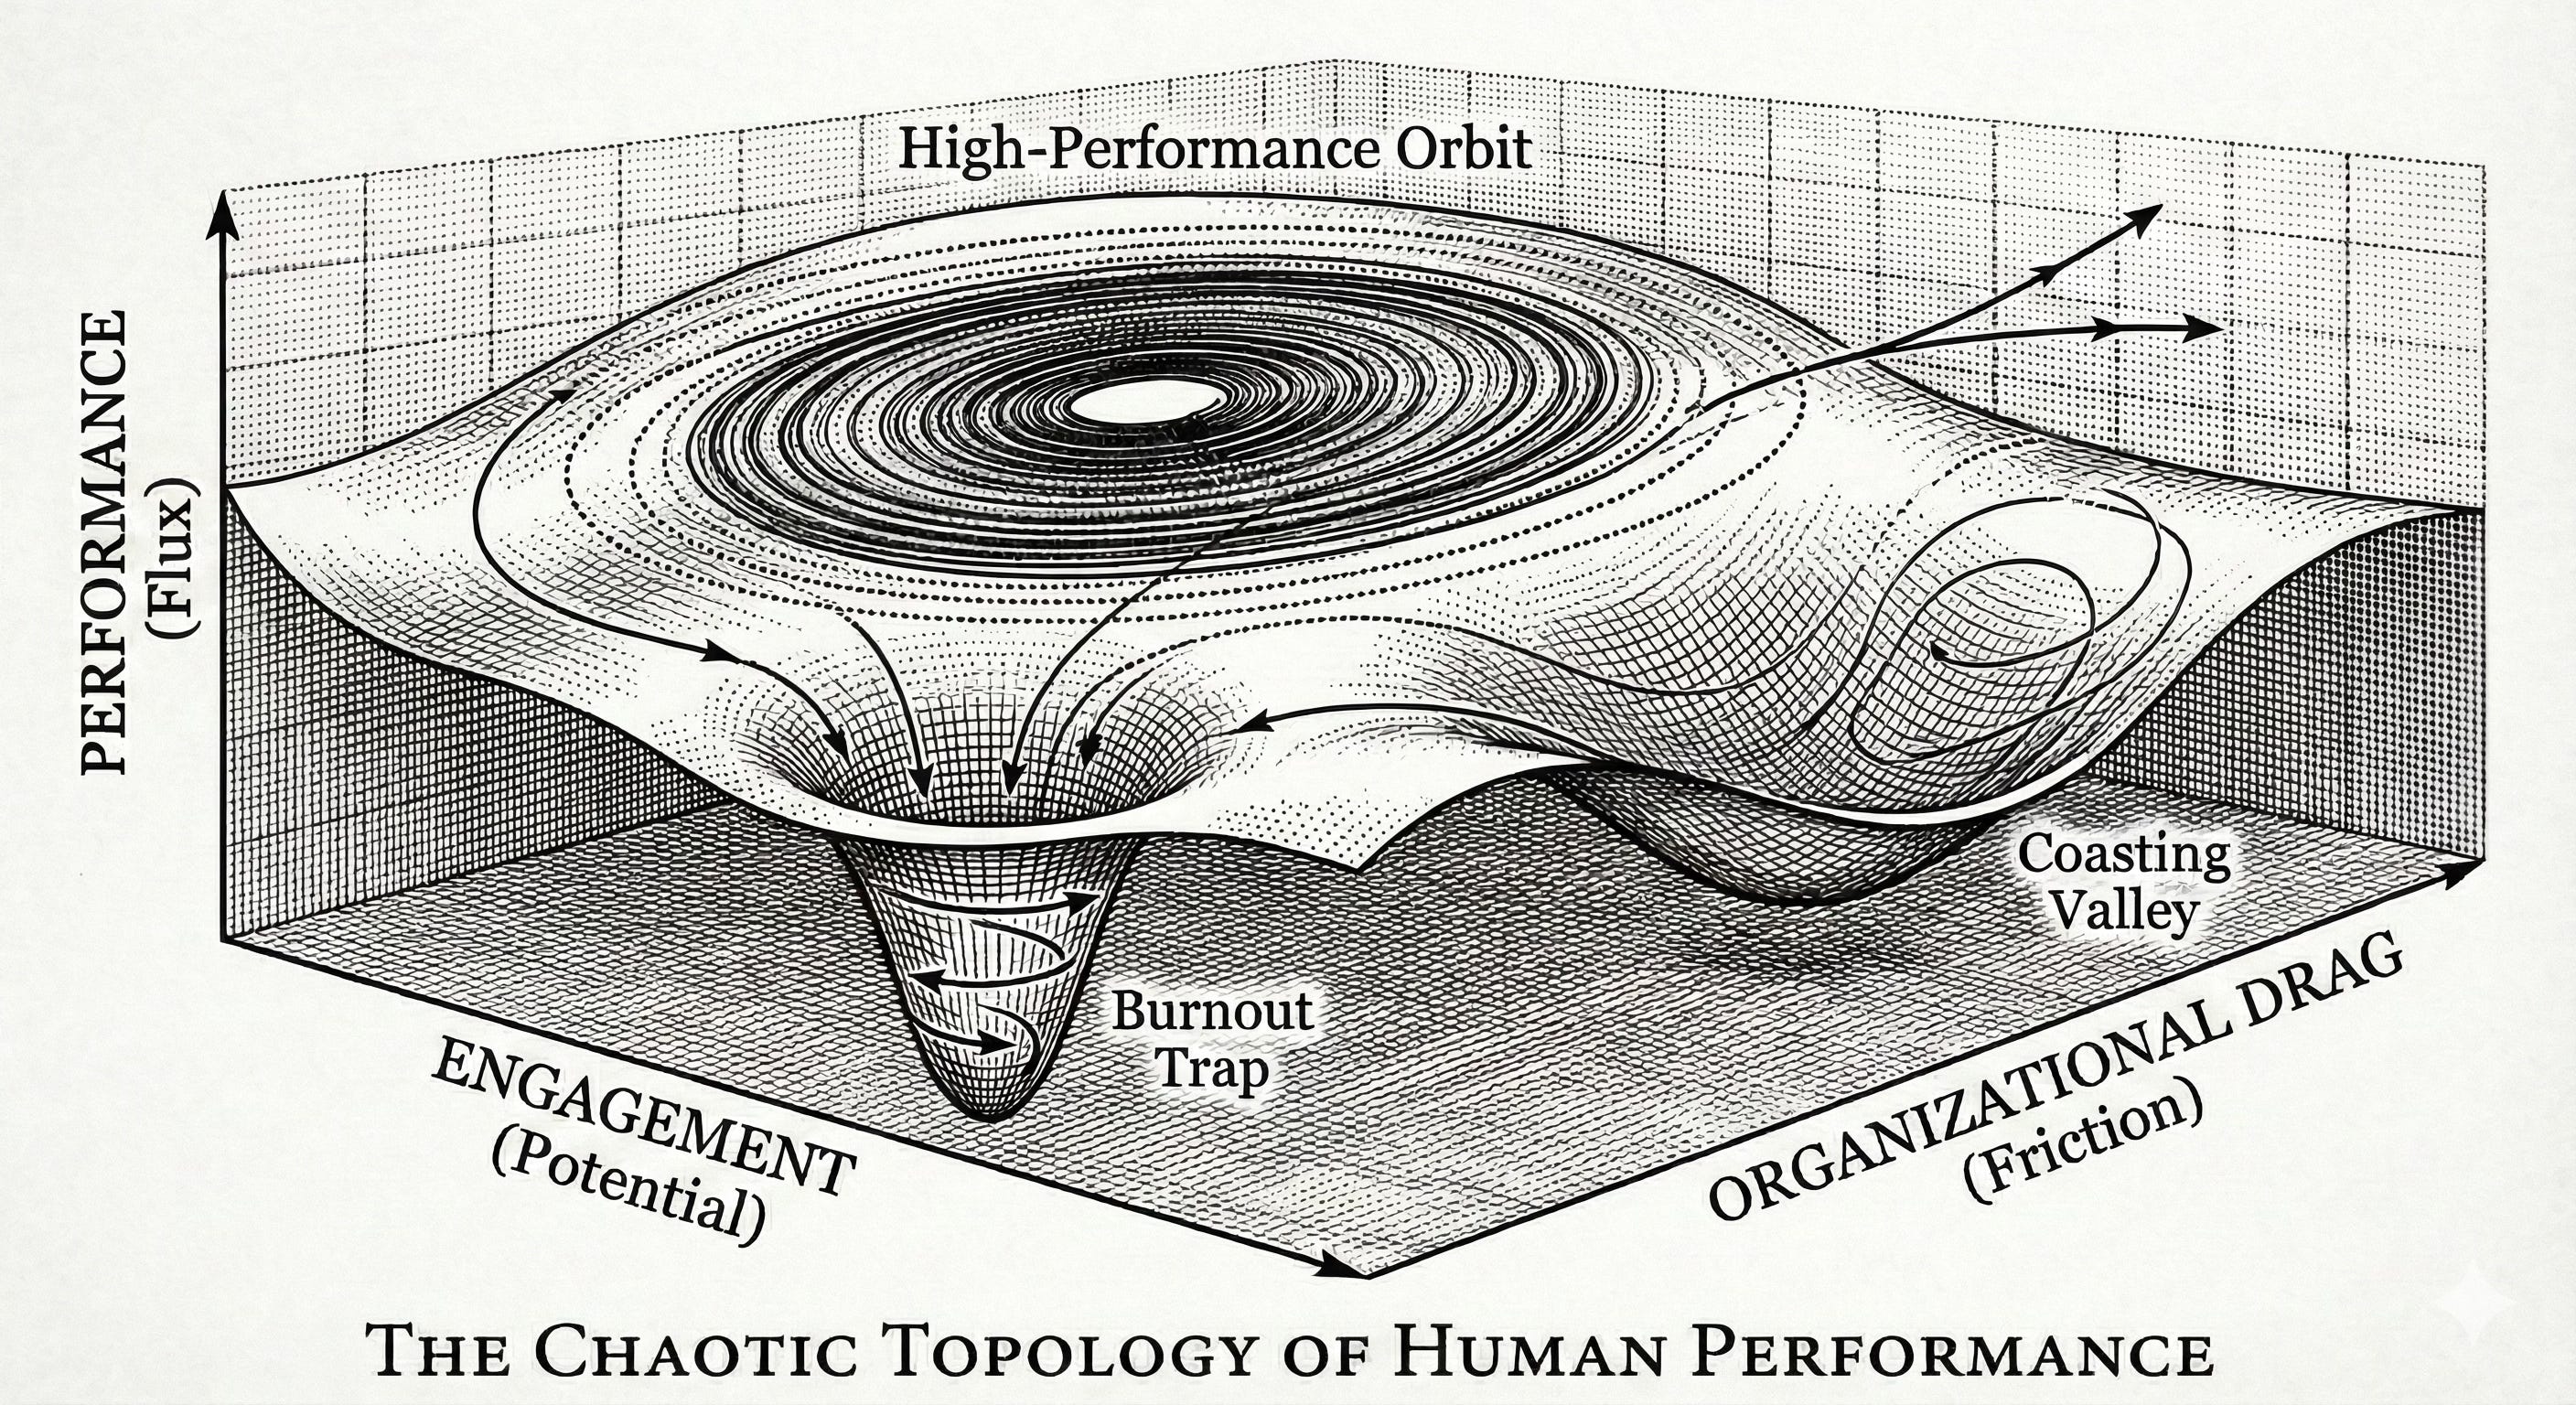
In our organizational river, the more extreme the topology, the more likely our kayakers are to be pulled into these currents. While world-class athletes might be able to navigate the wildest rapids, the best way to ensure the success of most kayakers is to pay close attention to which river we’re putting them in.
Evidence of Chaos: Psychological Safety
In physics, the “chaotic nature” of a system is quantified by the Lyapunov Exponent (𝜆). This number tells you just how sensitive Bob’s and Alice’s long-term experiences will be to their first day on the job:
Low 𝜆: The system is stable. You can nudge the pendulum, and it returns to its rhythm.
High 𝜆: The system is chaotic. A change of a few atoms changes the entire future.
If Bob misses lunch or makes a small comment about Project X and feels little impact from an honest mistake, we’d describe this system as having a Low 𝜆. In this system, it is “safe” to experience small deviations because they dampen out over time; trajectories correct themselves.
Amy Edmondson and Google’s Project Aristotle famously identified “Psychological Safety” as the key driver of team performance. Their description aligns perfectly with a system that has a low Lyapunov Exponent:
“[People] feel confident that no one on the team will embarrass or punish anyone else for admitting a mistake, asking a question, or offering a new idea.”
The fact that these teams perform higher implies that psychological safety describes the physics of the team. In a “Low Safety” (High 𝜆) organization, every small error is amplified. A missed meeting becomes a reputational hit. A failed experiment becomes a mark on your permanent record. Performance becomes unpredictable and unmanageable, not because the people are difficult, but because the system is volatile.
Psychological Safety is not a “soft” concept or a nice feeling of inclusion. It is a critical metric describing the stability of your organization’s physics.
Focus on the Environment
The typical, and least productive, response to the Alice and Bob scenario is to focus on the laptops: “We must ensure all future hires get laptops at precisely 9:00 AM.” This is a fool’s errand. In a chaotic system, you can never control initial conditions with enough precision. There will always be a variable you missed.
If better hiring (smarter people) doesn’t equate to higher performance, but a more forgiving environment does, then we have strong evidence that we are dealing with a chaotic system. And if we are dealing with a chaotic system, then trying to guarantee an individual outcome is a waste of time.
The most important work we can do is to understand the attractors. We can’t predict where Alice will be in a year, but we can map the currents she’ll encounter. IO Psychology gives us clues on how to engineer a ‘High Performance’ attractor rather than a ‘Burnout’ attractor:
Dampen the Noise: Promote cultures where small initial perturbations don’t cascade into failure.
Focus on Recovery: Resilience is more valuable than perfection. How quickly does an employee’s trajectory stabilize after a shock?
Managing The Chaos
Our regression models are powerful tools but only if we are operating in regimes where they are valid approximations of the physical system they are meant to represent. Understanding where we have high λ and actively managing lambda will allow us to take advantage of those models. Here are three new types of measurement that could help us understand the physics of our organizations:
The Twin Test: Track “statistical twins” (similar hires). Do their paths stay parallel (Low Chaos) or do they diverge wildly (High Chaos)? This is the best direct measurement of λ you have. Practically we can identify these twins using statistical techniques like Propensity Score Matching to find ‘nearest neighbors’ and see if their outcomes vary proportionally to their differences. Roles or teams with high λ deserve your attention. The best intervention we know of so far is to drive up psychological safety in these areas.
The Fragility Check: If a person or a team experiences a high-pressure event do they return to normal after conditions return to normal? Or does their performance seem to change permanently? A system that doesn’t return to baseline is a system that has “bifurcated.” Bifurcation is further evidence of a chaotic system and could be an alternative to the twin test if a role is too unique to provide any statistical twins.
The Prediction Horizon: Determine your organization’s “Event Horizon.” Can you predict performance 1 week from now, 3 months? 6 months? Because chaotic systems are not random, predictions tend to be better the closer they are in time. Look for factors that lead to longer prediction horizons. These could be important tools to add to your toolbox of interventions.
We are not managing automatons; we are managing teams of people. People working in teams have a tremendous impact on each other. Recognizing and embracing performance as the product of a nonlinear system will lead us to better measurement and intervention.
Our regression models are powerful tools, but only if we operate in regimes where they are valid approximations of reality. Understanding where we have high λ, and actively managing it, is how we make those models useful. Here are three types of measurement that could help us understand the physics of our organizations:
The Twin Test: Track “statistical twins” (hires with similar propensity scores). Do their paths stay parallel (Low Chaos), or do they diverge wildly (High Chaos)? This is the best direct proxy for λ. Roles with high divergence deserve immediate attention.
The Fragility Check: If a person or team experiences a high-pressure event, do they return to baseline after conditions normalize? Or does performance change permanently? A system that doesn’t return to baseline has “bifurcated,” another hallmark of chaos.
The Prediction Horizon: Determine your organization’s prediction Horizon. Can you predict performance 1 week out? 3 months? 6 months? In chaotic systems, prediction accuracy decays exponentially over time. Knowing your horizon will save you from confusing random guesses for predictions.
AI Won’t Save Us
Right now, there is a fever pitch in HR Technology. Vendors promise that with enough data and powerful enough AI, we can finally predict high performers. They claim Large Language Models (LLMs) will “reason out” patterns invisible to humans.
However, if individual performance is the result of a chaotic process, these claims are mathematically impossible for the long term.
AI is a statistical tool, not a crystal ball. It works by projecting historical patterns forward. In a Linear or Random system, this works beautifully. But in a Chaotic system, history is a poor predictor of the future.
The limitation isn’t computing power; it’s the topology of the system. To double your prediction window in a chaotic system, you need exponentially more precise data, not just more data. To predict a career path with certainty, you would need to know the initial conditions with infinite precision, down to the firing of a neuron. Since we can’t do that, long-term AI prediction models will always collapse into “hallucinations” or generic guessing.
Does this mean AI is useless in People Analytics? Absolutely not. It means we need to flip the value proposition.
Using AI as an Oracle (to predict the fate of an individual) is a waste of resources. We should instead use it as a Cartographer (to map the attractors and invisible currents).
AI may prove to be exceptionally good at this task. In addition to the measures of chaos suggested above we should consider using AI for the following:
Measuring Drag (z): AI can analyze communication metadata to map “Bureaucratic Heat Maps.” Where does work slow down? Where does complexity spike?
Mapping Currents: By analyzing network traffic (ONA), AI can show us the “Eddies” of safety and the “Whirlpools” of isolation.
Detecting Bifurcation: AI can monitor shifts to warn us when a team is approaching the “Critical Threshold”, the moment before the system snaps from stable to chaotic.
The goal is not to know what the employee will do, it is to understand and engineer the river.
Appendix: The Rigorous Math (For the Nerds)
For those interested in the formal dynamical systems theory behind this argument, we can model organizational performance using a variation of the Lorenz Attractor. The work below was supported by Gemini Pro and is not provided as a proof of chaotic behavior, simply as a demonstration that under certain assumptions human performance could be described using the physics of chaos.
We can define the state of an employee at time t as a vector v(t) ∈ R3:
x(t): Performance Output (Rate of work)
y(t): Engagement/Potential (Internal energy)
z(t): Organizational Drag (Friction/Entropy)
The time evolution of these variables is governed by the following coupled non-linear differential equations:
\(\begin{aligned} \frac{dx}{dt} &= \sigma (y - x) \\ \frac{dy}{dt} &= x(\rho - z) - y \\ \frac{dz}{dt} &= xy - \beta z \end{aligned}\)
The Terms:
σ (Agility): The rate at which potential (y) converts to performance (x).
ρ (Pressure): The external incentive or drive applied to the system.
β (Hygiene): The rate at which the organization dissipates bureaucratic drag (z).
The Proof of Chaos: The critical term is -xz in the second equation. This represents Burnout Coupling. As Drag (z) increases, high Performance (x) actively destroys Engagement (y).
Stability analysis shows that when Pressure (ρ) exceeds a critical threshold ρc, the fixed point of the system becomes unstable (via a Hopf Bifurcation).
\(\rho_c = \frac{\sigma(\sigma + \beta + 3)}{\sigma - \beta - 1}\)
Beyond this threshold, the system enters a chaotic regime. In this state, the distance between two initially close trajectories (δZ0) grows exponentially according to:
\(|\delta Z(t)| \approx e^{\lambda t} |\delta Z_0|\)
Where λ is the positive Lyapunov exponent. This demonstrates that in high-pressure, high-drag environments, long-term prediction of individual performance could be mathematically impossible, regardless of data quality.
Great post! Subscribed.